A distributor before the monthly meeting with a company's area manager
- Today. Exports two months of the sales register and subtracts them in Excel.
- With Takkada. Sorts by Biggest drop and opens the group at the top into its items.

Tally can repeat a report period by period in columns, but it leaves the change for you to work out and keeps its own row order. Sales Comparison puts each stock group's sales side by side by month or quarter, shows the change in percent, sorts by the biggest drop or rise, and opens any group into its items.
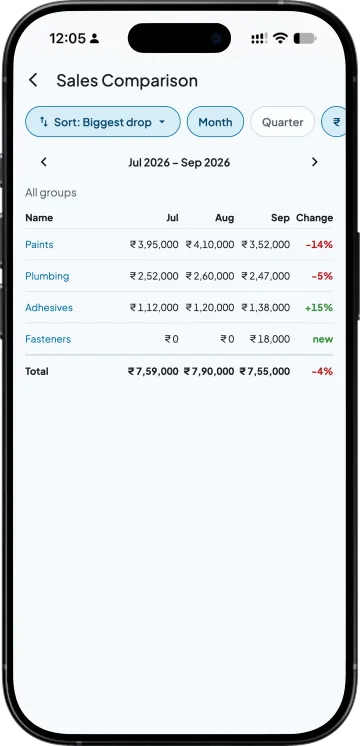
Months or quarters as columns, each stock group's net sales in a row. Sort by Latest, Biggest drop or Biggest rise; a group that sold nothing before shows new, and the current month is marked so far. Paints sold 14% less in September than in August, so its Change reads -14%.
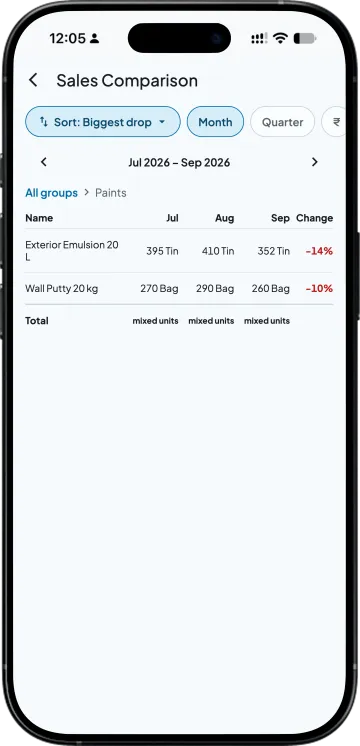
The group's items in the same columns, so the item that fell stands out. Switch to quantity to see whether fewer units went out or the same units went at a lower rate.
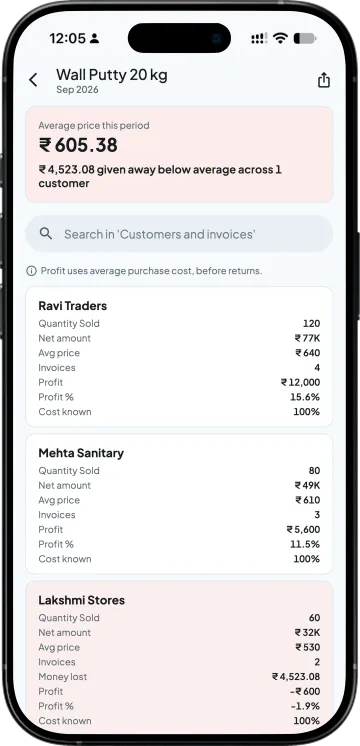
Rows here are stock groups and items, so open the item in Sales by Item for its customers at their average price. Sales by Item takes customer returns (credit notes) off and shows them in a Returns column.
| What you need | Tally with Takkada | Tally alone |
|---|---|---|
| Periods side by side | Months or financial-year quarters, chosen in one control. | A column added for each period with Alt+C (New Column). |
| The change | A Change column in whole percent; new when the earlier period was nil. | Worked out in Excel. |
| Order | Latest, Biggest drop or Biggest rise. | The report's own order. |
| Rows | Stock groups, opening into their items. | The rows of the report you opened. |
| A half month | Marked so far. | Read like a full month. |
Rows are stock groups and their items. For sales by customer, use Sales by Item grouped by Customer, which shows customer returns (credit notes) in a Returns column. Free goods stay in the quantity.
Sales Comparison is on every plan, with the same access as Sales by Item.
Momentum ₹3,375/year + GST on a 3-year term
See what every plan includesIn Tally Prime, open the report for the first month and press Alt+C (New Column) to add the second period beside it. Tally shows the two columns but leaves the change for you to work out. In Takkada, Sales Comparison shows each stock group by month with the change in percent.
Because it is not over yet. The running month is marked so far in Sales Comparison, so fifteen days of sales are not read as a fall against a full month. Compare it again once the month closes, or read the last two full months.
No. Rows in Sales Comparison are stock groups and their items. To see sales by customer, open Sales by Item and group it by Customer, which shows each customer with the change against the previous period.
Yes. Switch between rupees and quantity at the top of Sales Comparison. Quantity shows whether fewer units went out, which tells a real drop in demand apart from the same units sold at a lower rate.
It means the group or item sold nothing in the earlier period and something in the later one, so there is no percent to show. Every other row shows the change between the last two periods in whole percent, such as -14% or +15%.
Yes. Choose quarters and the columns become financial-year quarters, headed like Q2 26-27, with the same Change column and the same sorting. Quarters suit a business whose months swing with festivals or with company schemes.
Book a demo. We walk through your setup, your Tally version, and exactly what changes for your business.